Sentry Performance Monitoring for Elixir
11 Jun 2022Sentry added support for performance monitoring (also known as distributed tracing) some time ago. It comes with excellent library support for many languages. There is an official Elixir library for Sentry integration, but it lacks the performance monitoring feature. In this post, I will explain how we capture traces and integrate them with Sentry.
We have a mix of Ruby, Elixir, and Node.js applications, and a Go application is thrown in for good measure. So we had to find a solution that works well with the sentry libraries maintained by Sentry.
Distributed Trace
A Trace records operations across multiple applications within the context of a single root operation, typically a user initiated request. Each individual operation is called span.
OpenTelemetry
OpenTelemetry is an initiative that tries to standardize application observability APIs and tools. It supports traces in addition to other signals and has good library support for Elixir. The idea is to use the opentelemetry-erlang in Elixir applications and send all the traces to OTEL Collector. Collector has pluggable exporters, sentry-exporter is used to forward the traces to Sentry.

Context Propagation
Whenever an application requests another application, it has to
propagate some context like trace_id, span_id, sampled?,
etc. Sentry uses the sentry-trace header, which is quite similar
to the W3C trace-parent header. Even though opentelemetry-erlang
doesn’t support the sentry header format, it was trivial to write a
custom propagator for the sentry.
config :opentelemetry,
  text_map_propagators: [OpentelemetrySentry.Propagator],
  span_processor: :batch,
  traces_exporter: :otlp,
  sampler: {:otel_sampler_parent_based,
             %{root: {:otel_sampler_trace_id_ratio_based, 0.1}}},
  resource: [service: %{name: "foo"}]

config :opentelemetry_exporter,
  otlp_protocol: :http_protobuf,
  otlp_endpoint: "http://otel-collector.acme.com:4318"
OTEL Collector Configuration
Once the traces reach the collector, they get exported to the sentry.
exporters:
  sentry:
    dsn: https://key@sentry.acme.com/path/42
The sentry exporter accepts only one DSN, which is mapped to a single sentry project. Traces from different applications must not be exported to a single sentry project, and we prefer not to run a collector per application. Fortunately, the collector is flexible enough that we can handle this via the routing processor. In the example below, the traces get routed to the correct sentry project based on the service name.
processors:
  batch: {}
  routing:
    attribute_source: resource
    from_attribute: service.name
    default_exporters:
    - logging
    table:
    - value: foo
      exporters: [sentry/foo]
    - value: bar
      exporters: [sentry/bar]
exporters:
  logging: {}
  sentry/foo:
    dsn: https://key@sentry.acme.com/path/42
  sentry/bar:
    dsn: https://key@sentry.acme.com/path/11
service:
  pipelines:
    traces:
      receivers:
        - otlp
      processors:
        - batch
        - routing
      exporters:
        - logging
        - sentry/foo
        - sentry/bar
Fine tuning
OpenTelemetry Collector Contrib comes with a huge list of processors. For example, the way database span is named is different in opentelemetry-erlang compared to how it is handled by other sentry libraries. The query itself is used as a part of the span name. We were able to easily solve this problem by rewriting the span name using the span processor.
span/db:
  include:
    match_type: regexp
    span_names: ["\\.repo\\.query"]
  name:
    separator: ":"
    from_attributes: [db.statement]
Known issues
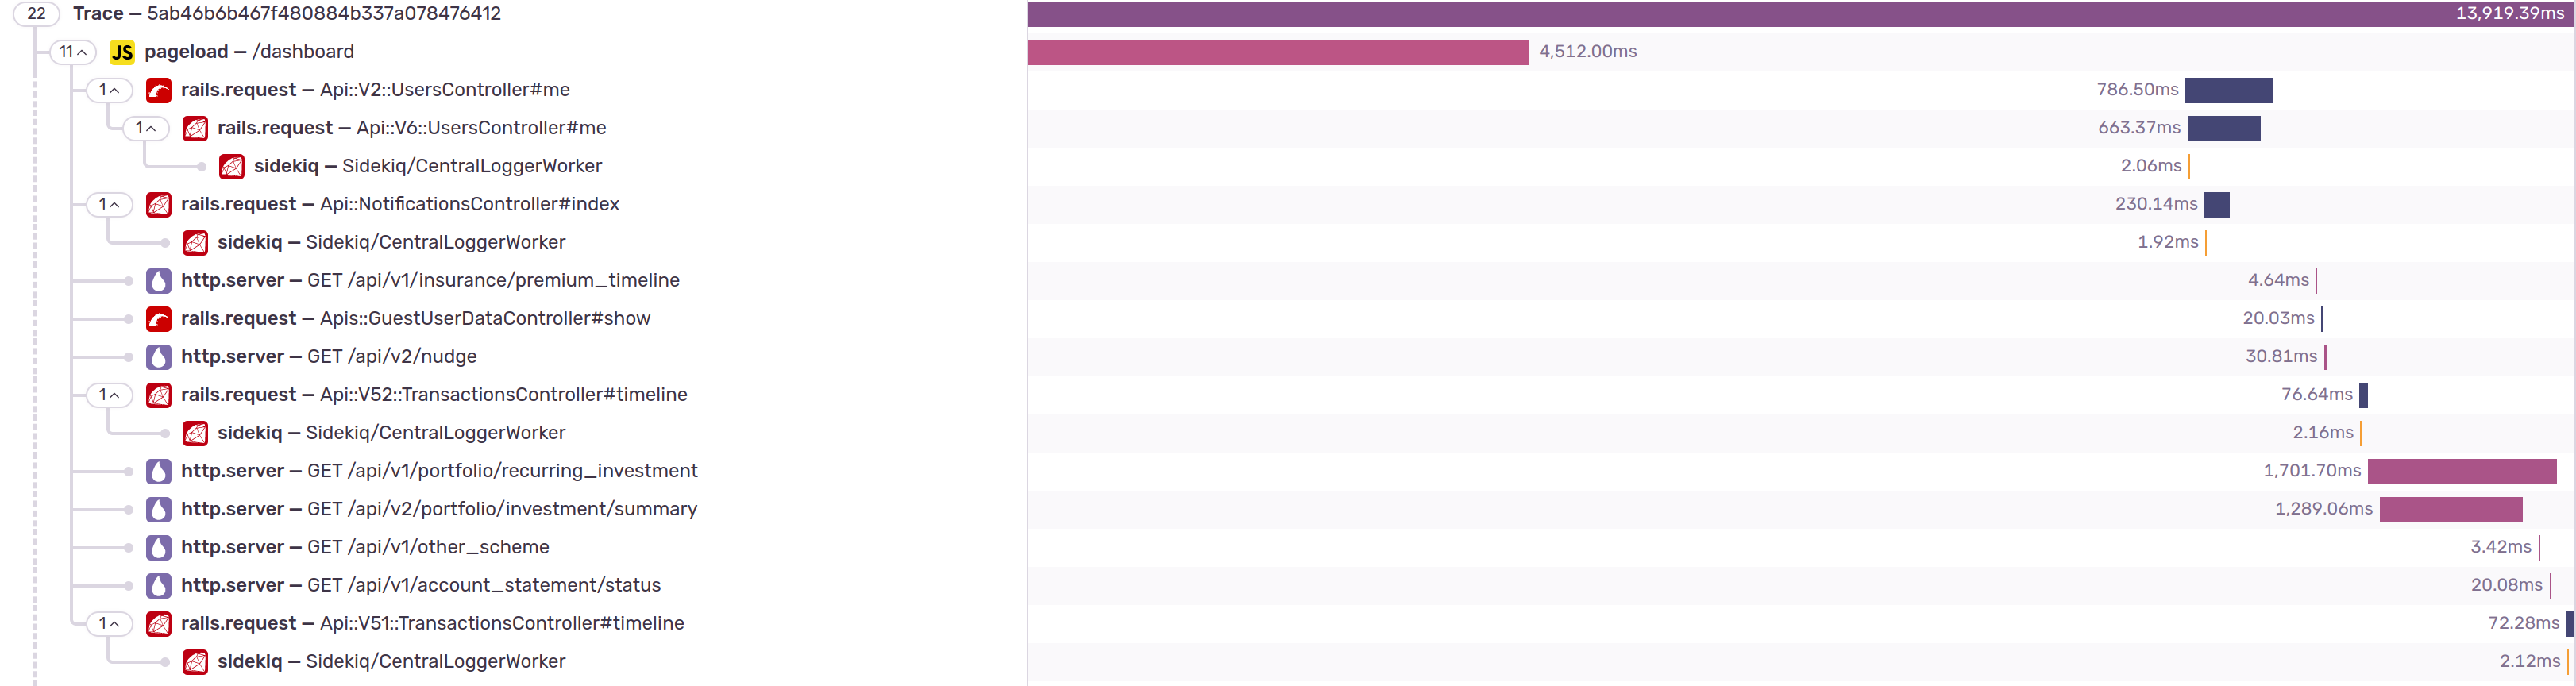
There is a difference between the trace data model used by Sentry and OpenTelemetry. In OpenTelemetry, a trace is a set of spans that form a tree structure. Sentry follows a similar model, except some spans get called transactions. In the diagram below, application boundaries get represented by different colors. Sentry calls the root span within each application boundary as a transaction.

Since sentry-exporter creates these transactions based on heuristics, it may sometimes group spans within an application into multiple transactions. This issue happens especially in traces with a lot of spans.