ETS vs Redis
26 Oct 2024I recently made some optimizations at work that saved more than 40% CPU at peak time. In this post, I go over the details about how I identified and fixed the bottleneck.
Preparation
The first step is to identify the bottleneck. There might or might not be a single big bottleneck in a system. Usually, it’s not straightforward to replicate the production workload on a staging or developer machine. Instead, I focused on profiling the system in production without disrupting live workloads.
Erlang provides a range of tools to find memory or CPU
bottlenecks. However, most of them are only suitable to run on a
developer machine because of the performance overhead. Erlang also
provides support for a Linux profiler called perf. I added
+JPperf true to the rel/vm.args.eex file to enable perf support.
Data collection
sudo perf record -g -F 99 --pid 607343 --call-graph=fp -- sleep 10
sudo perf script --header > out.stacks
Let’s break down the steps. The first command perf record collects
data, and the second command just reformats the collected data. -F
controls the sampling frequency; the default is usually set to 1000,
but I typically reduce this to 99 on a production system to reduce the
profiling overhead.
~/FlameGraph/stackcollapse-perf.pl < /tmp/out.stacks | \
  sed -e 's/^[0-9]\+_//' -e 's/^erts_\([^_]\+\)_[0-9]\+/erts_\1/' | \
  ~/FlameGraph/flamegraph.pl --hash > /tmp/flame.svg
Copy the out.stacks file to your local machine and use
FlameGraph to convert it to a flamegraph.
Hypothesis
The percentage of the Elixir stack was so small it didn’t even show up
anywhere unless one started to zoom in. There were a lot of
[unknown] stacks as well, which I have’t yet figured out how to
fix. Playing around with the flamegraph for a bit, I noticed the
binary_to_term_1 with 3.02% usage and another place with exactly
the same children, just with the name binary_to_term_1 missing. The
total usage added up to 31.87%. I assumed both were the same and
started to look into our codebase for binary_to_term usage.
$global::call_light_bif_shared > binary_to_term_1 > [beam.smp] > [beam.smp] > erts_atom_put > erts_atom_put_index
$global::call_bif_shared > beam_jit_call_bif > [beam.smp] > [beam.smp] > erts_atom_put > erts_atom_put_index
We use Redis heavily for our caching use cases and use
:erlang.term_to_binary(term, compressed: 6) for serialization and
:erlang.binary_to_term(data) for deserialization. Switching to any
other serialization format is out of the question since it’s unlikely
to be faster than the native serialization format.
Using an in-memory cache is another viable approach. ETS-based cache
is one of the straightforward ways to achieve in-memory caching. But
there is one caveat: unlike other programming languages, Erlang uses a
per-process heap, so whenever you fetch something from ETS, it’s going
to copy the term into the current process’s heap. So there is some
amount of copying involved. The question is, how does ETS copying
compare with binary_to_term?
I ran a local benchmark for a very large object (7 MB compressed), and the results were impressive. I chose a large object to make sure the deserialization would be the bottleneck.
Name            ips        average  deviation         median         99th %
ets           11.77       84.93 ms     ±7.99%       83.92 ms      111.97 ms
redis          1.83      546.06 ms     ±5.44%      537.49 ms      626.95 ms

Comparison:
ets           11.77
redis          1.83 - 6.43x slower +461.13 ms
Experiment
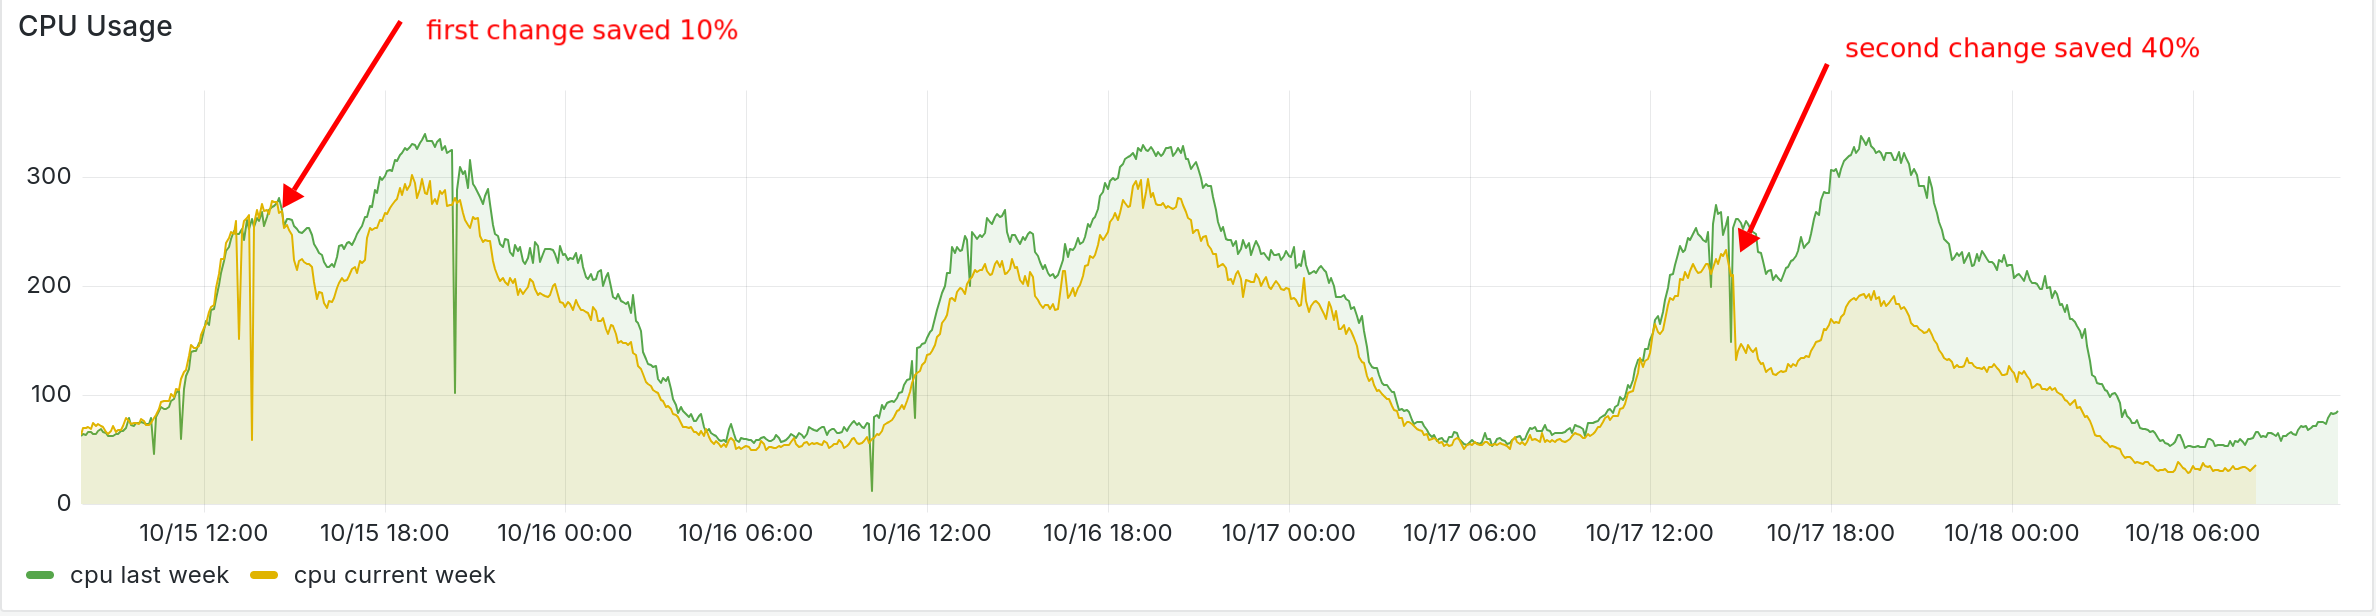
I pushed a buggy version on day 1, which didn’t properly backfill the in-memory cache in the cache miss scenario. With the fix landed, we got more than 40% CPU reduction.
I regenerated the flamegraph again, and as expected, the
binary_to_term_1 function is nearly gone from the graph. Of course,
we now get ets_lookup_2, which takes up 11.92%, but this is much
better than 31.87%. We also set the compress flag in ETS to
true, which handles atoms and binaries more efficiently. Even
though we only reduced 20%, the net CPU difference is 40%. I
assume the other 20% might come from better garbage collection since
we don’t keep creating duplicate binaries when we deserialize.
We still use Redis, with the in-memory cache as another layer in front of it. We use versioned cache keys, so the invalidation of the in-memory cache is not really an issue.